When you enroll in this course, you'll also be enrolled in this Professional Certificate.
Learn new concepts from industry experts
Gain a foundational understanding of a subject or tool
Develop job-relevant skills with hands-on projects
Earn a shareable career certificate from Coursera
There are 9 modules in this course
You will develop reproducible analytics practices using R, paired with governance controls that make research outputs auditable and reliable for stakeholders. The course begins with file management and naming conventions, metadata tagging, and data-quality KPI monitoring to ensure high data integrity standards. It then introduces core R skills for data import, tidy transformations, and pipe-based workflows to join, filter, and aggregate multi-source datasets using the Tidyverse ecosystem. You will learn to author parameterized R Markdown reports to automate regular reporting and to perform diagnostic tests—such as cross-validation and resampling—to evaluate the robustness of regression and predictive modeling techniques commonly used in market research.
The curriculum embeds responsible LLM summarization of qualitative data and synthetic-data evaluation use-cases, teaching you how to detect and mitigate hallucination and bias in automated outputs. Labs focus on building end-to-end analytic pipelines that produce reproducible deliverables, paired with rigorous checks that validate metrics against source data to ensure trustworthy results. You will conclude the course by creating a portfolio-ready Data Pipeline and Model Validation Lab, demonstrating your ability to manage the entire data lifecycle from raw ingestion to predictive modeling and executive-ready automated reporting.
The Summarize and Evaluate Ethical AI Insights innovative module develops cutting-edge skills in AI-assisted qualitative analysis and ethical data practices. You will master techniques for using large language models to summarize qualitative data and critically evaluate the ethical implications of synthetic data. Through hands-on application, you will build advanced capabilities that combine AI tools with ethical considerations to enhance research insights.
What's included
4 videos3 readings4 assignments
Show info about module content
4 videos•Total 28 minutes
What are AI-Powered Thematic Summaries?•7 minutes
A Tale of Two Prompts: Good vs. Bad Examples•8 minutes
The Double-Edged Sword of Synthetic Data•6 minutes
What to Look For: Identifying Bias and Privacy Leaks•7 minutes
3 readings•Total 20 minutes
Foundations of Prompt Engineering for Qualitative Insights•7 minutes
A Framework for Iterative Prompt Refinement•6 minutes
Understanding the Risks: Privacy, Bias, and Fidelity in Synthetic Data•7 minutes
4 assignments•Total 85 minutes
Hands-On Learning: Your First AI-Augmented Summary•30 minutes
Knowledge Check: Principles of AI Summarization•5 minutes
Hands-On Learning: Drafting an Ethical Mitigation Plan•20 minutes
AI Ethics and Application Project•30 minutes
Organize Research Data: File Management
Module 2•2 hours to complete
Module details
Organize Research Data: File Management module provides a professional foundation for bringing order to digital chaos. You will navigate the essential stages of data processing—from raw collection to final analysis—while mastering standardized naming conventions and file structures.
Through hands-on labs and real-world case studies, you'll develop the governance skills necessary to prevent costly errors and ensure long-term data integrity. By implementing these systematic approaches, you will transform disorganized files into accessible, high-value knowledge repositories. This experience empowers you to maintain reliable research systems that support accurate, data-driven decision-making.
What's included
4 videos4 readings5 assignments
Show info about module content
4 videos•Total 20 minutes
The Reinhart-Rogoff Error: A Cautionary Tale•6 minutes
Spot the Difference: Identifying Data Stages in Clinical Trials•5 minutes
Walmart's Secret Weapon: Data Organization•4 minutes
Building Your Naming Convention: A Step-by-Step Guide•5 minutes
4 readings•Total 24 minutes
The Three Stages of Data: Raw, Cleaned, and Analyzed•5 minutes
Career Focus: The Data-Savvy Professional•5 minutes
The Unseen Engine of Efficiency: A Strategic Approach to File Naming•7 minutes
Career Focus: Your Data Organization Portfolio•7 minutes
5 assignments•Total 65 minutes
Hands-On Learning: Data Sherlock: Classifying Sample Files•15 minutes
Knowledge Check: Data Stages Pop Quiz•5 minutes
Hands-On Learning: The Great File Rename•15 minutes
Knowledge Check: Data management Pop Quiz•5 minutes
The Research Rescue Project•25 minutes
Govern and Evaluate Research Data Quality
Module 3•2 hours to complete
Module details
Govern and Evaluate Research Data Quality module builds data governance and quality management capabilities for research professionals. You will develop skills in applying metadata tagging for effective data governance and evaluating data quality against defined standards. Through practical application, you will build the technical capabilities needed to implement robust data management practices that ensure information integrity and accessibility.
What's included
4 videos3 readings3 assignments
Show info about module content
4 videos•Total 27 minutes
What is Data Governance?•7 minutes
How to Apply Metadata Tags in a Simulated Environment?•6 minutes
When Good Data Goes Bad: A National Emergency•6 minutes
How to Create a Remediation Ticket in Jira?•8 minutes
3 readings•Total 19 minutes
Decoding Data Governance Policies•8 minutes
Understanding Data Quality Reports and KPIs•7 minutes
Anatomy of an Effective Remediation Ticket•4 minutes
3 assignments•Total 55 minutes
Hands-On Learning: Tagging the Legacy Dataset•20 minutes
Knowledge Check: Interpreting Your Forecast•5 minutes
Data Governance and Quality Toolkit•30 minutes
R: Code, Import, Transform Data
Module 4•2 hours to complete
Module details
R: Code, Import, Transform Data is your professional entry point into the world of data analysis. Designed for aspiring analysts, this module teaches you to write R scripts that take full control of your datasets. You will progress from understanding core syntax—variables, vectors, and data frames—to importing CSVs and performing essential cleaning tasks. Through hands-on labs, you will master selecting data and renaming columns for maximum clarity. By the end, you'll have built a functional script that prepares raw data for analysis, a fundamental skill used by organizations like the BBC. This experience provides the critical building blocks for a successful data-driven career.
What's included
4 videos2 readings3 assignments
Show info about module content
4 videos•Total 24 minutes
What Are Variables and Vectors?•7 minutes
How to Create Variables, Vectors, and Data Frames in R?•6 minutes
From Raw Data to Key Insights•6 minutes
From Import to Clean Data in R•5 minutes
2 readings•Total 22 minutes
Understanding R's Core Data Structure: The Data Frame•10 minutes
The Data Import and Transformation Workflow•12 minutes
3 assignments•Total 50 minutes
Hands-On Learning: Your First R Objects•15 minutes
Knowledge Check: R Syntax Challenge•5 minutes
Write a Data-Cleaning R Script•30 minutes
Transform, Analyze, and Report Data with R
Module 5•3 hours to complete
Module details
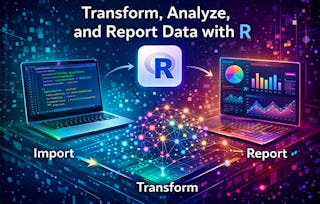
Transform, Analyze, and Report Data with R is your gateway to robust, scalable analysis. Designed for aspiring analysts, this module teaches you to build sophisticated end-to-end projects using the "Tidyverse" approach. You'll master dplyr to create clean, pipe-based workflows for filtering and merging complex data. You will also master automation—the hallmark of modern analysis—using R Markdown to generate dynamic reports. Finally, you'll evaluate predictive models using diagnostic tools like ROC curves. By the end, you'll have a portfolio-ready project and the skills to build efficient, reproducible workflows. No prior R experience is necessary.
What's included
6 videos3 readings6 assignments
Show info about module content
6 videos•Total 32 minutes
Why Data Wrangling is the Heart of Analysis?•6 minutes
Mastering the dplyr Verbs•6 minutes
The Power of Push-Button Reporting•6 minutes
Introduction to knitr and Code Chunks•4 minutes
Why is a Single "Accuracy" Score Not Enough?•5 minutes
Evaluating a Classifier in R•6 minutes
3 readings•Total 32 minutes
A Guide to Data Wrangling: Tidy Principles and Table Joins•10 minutes
Guide to R Markdown: Anatomy and Career Value•10 minutes
Guide to Model Validation: Theory and Career Impact•12 minutes
6 assignments•Total 85 minutes
Hands-On Learning: Create a Tidy Customer Dataset•15 minutes
Knowledge Check: dplyr and Data Pipeline•5 minutes
Hands-On Learning: Parameterize an Analytics Report•15 minutes
Knowledge Check: R Markdown and Parameterization Quiz•5 minutes
Hands-On Learning: Practice with Model Diagnostics•15 minutes
End-to-End Customer Churn Analysis and Report•30 minutes
Excel for Data Analysis
Module 6•2 hours to complete
Module details
Excel for Data Analysis is a beginner-friendly guide to transforming raw numbers into compelling business stories. You will move beyond basic data entry to master essential statistical functions like AVERAGE, STDEV, and COUNTIF, enabling you to summarize complex datasets and uncover key metrics. Beyond calculations, you’ll learn the art of visual storytelling using conditional formatting to highlight trends and outliers. Through real-world scenarios—from sales tracking to NPS analysis—you will develop the skills to answer critical business questions. This experience culminates in a hands-on project, building a summary report that turns data into actionable insights.
What's included
6 videos3 readings4 assignments
Show info about module content
6 videos•Total 35 minutes
Finding a Story in 1.1 Billion Taxi Rides•7 minutes
From Data to Decisions: Structured Analysis with the Core Four•6 minutes
Applying Functions to the Bellabeat Dataset•6 minutes
From Numbers to Narrative: Visualizing the Bellabeat Story•5 minutes
Statistical Tests for Market Research builds essential capabilities for extracting defensible insights from raw data. You will develop a strong understanding of statistical functionality while mastering hypothesis testing to compare group differences. This module moves beyond simply running tests to explaining why they matter for business strategy. Through hands-on applications like A/B testing and customer satisfaction analysis, you will master the two-sample t-test in Excel. You'll learn to interpret critical metrics like the p-value and translate them into actionable recommendations. These foundational skills empower you to use statistical evidence to validate assumptions and drive data-driven decision-making.
What's included
3 videos2 readings5 assignments
Show info about module content
3 videos•Total 23 minutes
Your Analyst Toolkit: A Tour of Statistical Software•8 minutes
Hypothesis Testing Explained: The T-Test and P-Value•6 minutes
How-To: Run and Read a T-Test in Excel•9 minutes
2 readings•Total 16 minutes
From Business Questions to Statistical Answers with Excel•8 minutes
From Theory to Practice: T-Tests in a Professional Context•8 minutes
5 assignments•Total 70 minutes
Hands-On Learning: Exploring Descriptive Statistics in Excel•15 minutes
Knowledge Check: Choosing Your Tools and Concepts•5 minutes
Hands-On Learning: Comparing Two Marketing Campaigns•15 minutes
Your First Statistical Testing Portfolio Piece•30 minutes
Predict and Validate Regression Models in R
Module 8•2 hours to complete
Module details
Predict and Validate Regression Models in R is your professional entry point into the world of multiple linear regression. Designed for aspiring analysts, this module empowers you to build and interpret predictive models from the ground up. You will move beyond simply running code to critically evaluating performance through hands-on labs and real-world case studies. You will master diagnosing statistical assumptions using residual plots and assessing model reliability with k-fold cross-validation. By the end, you will build trustworthy models and generate dependable forecasts. This experience culminates in a validated, portfolio-ready project that supports strategic business decisions with confidence.
What's included
4 videos4 readings4 assignments
Show info about module content
4 videos•Total 26 minutes
Beyond Accuracy: The Danger of a "Wrong" Model•7 minutes
Building and Diagnosing a Regression Model in R•7 minutes
The High-Stakes World of Clinical Trials•7 minutes
Implementing 10-Fold Cross-Validation in R•6 minutes
4 readings•Total 24 minutes
The Anatomy of a Multiple Regression Model•8 minutes
Connecting Your Skills to Your Career•3 minutes
Understanding K-Fold Cross-Validation•8 minutes
Your Future in Advanced Analytics•5 minutes
4 assignments•Total 95 minutes
Hands-On Learning: Build and Diagnose a Predictive Regression Model•30 minutes
Knowledge Check: Interpreting Model Output and Diagnostics•5 minutes
Hands-On Learning: Validate Model Stability with K-Fold Cross-Validation•30 minutes
Predict and Validate Housing Prices•30 minutes
Data Pipeline and Model Validation Lab
Module 9•2 hours to complete
Module details
Data Pipeline and Model Validation Lab is where you build a professional, reproducible R workflow. You will integrate data from multiple sources—CSVs, Excel, and JSON—while applying governance standards through automated metadata tagging and standardized cleaning. Using the tidyverse and dplyr, you'll develop pipe-based scripts to merge complex datasets and create parameterized R Markdown reports. The module culminates in building a multiple linear regression model, validated through 5-fold cross-validation and diagnostic plots. By the end, you will have a project demonstrating the technical and governance skills required for senior analytical roles.
What's included
2 readings1 assignment
Show info about module content
2 readings•Total 6 minutes
Why This Project Matters•3 minutes
Project Requirements•3 minutes
1 assignment•Total 110 minutes
Project: Reproducible Data Pipeline and Model Validation Lab•110 minutes
Earn a career certificate
Add this credential to your LinkedIn profile, resume, or CV. Share it on social media and in your performance review.
Coursera brings together a diverse network of subject matter experts who have demonstrated their expertise through professional industry experience or strong academic backgrounds. These instructors design and teach courses that make practical, career-relevant skills accessible to learners worldwide.
Do I need prior R programming experience for this course?
No. This course is designed for beginners, providing a comprehensive introduction to R programming and data analysis. You'll start with foundational concepts and gradually build skills through hands-on exercises and practical examples.
What tools will I learn to use in this course?
You'll gain proficiency in R, RStudio, the Tidyverse ecosystem, R Markdown, and techniques for ethical data analysis and model validation.
What career opportunities does this course prepare me for?
This course builds skills for data analyst, market research, business intelligence, and data science roles across industries like technology, consulting, market research, and finance.
When will I have access to the lectures and assignments?
To access the course materials, assignments and to earn a Certificate, you will need to purchase the Certificate experience when you enroll in a course. You can try a Free Trial instead, or apply for Financial Aid. The course may offer 'Full Course, No Certificate' instead. This option lets you see all course materials, submit required assessments, and get a final grade. This also means that you will not be able to purchase a Certificate experience.
What will I get if I subscribe to this Certificate?
When you enroll in the course, you get access to all of the courses in the Certificate, and you earn a certificate when you complete the work. Your electronic Certificate will be added to your Accomplishments page - from there, you can print your Certificate or add it to your LinkedIn profile.